The symptom is not the diagnosis
Your CPM is up 40% month over month.
CTR is sliding.
Frequency is climbing.
Every checklist you can find online says the same three words: refresh your creative.
So you brief a new batch. Three weeks of production.
New hooks, new formats, new talent. You launch.
CPM stays high. CTR does not recover. You have now spent the production budget, restarted the delivery system’s learning on your best-performing ad sets, and lost the only stable baseline you had.
Here is the part almost nobody teaches: ad fatigue vs audience saturation is not the only fork in the road. Rising CPM with falling CTR is a presenting complaint, not a diagnosis. At least five distinct conditions produce a near-identical chart, and four of them get worse when you treat them as fatigue.
Doctors do not prescribe from a symptom. They run a differential — a structured process of ruling conditions in and out until only one explanation survives. Media buying deserves the same discipline, because the cost of a wrong diagnosis here is not an inconvenience. It is a production cycle, a delivery reset, and a quarter of lost compounding.
What ad fatigue actually is (and what it isn’t)
Ad fatigue is the decline in response to a specific creative asset among people who have already been exposed to it. It is asset-specific, exposure-specific, and audience-specific. Rest the asset, introduce it to a fresh cohort, and a genuinely fatigued ad often performs again.
Audience saturation is the exhaustion of the addressable pool the delivery system can profitably reach under your current targeting, budget, and exclusions. It is not about the asset at all. New creative into a saturated pool buys a short bump, then the same wall.
They are frequently confused because both raise frequency and both depress CTR. But the fixes point in opposite directions. Fatigue is solved with new assets. Saturation is solved with a bigger pool. Apply the wrong one and you pay twice — once for the production, once for the delivery reset.
The five conditions that produce the same chart
| Condition | What actually changed | Distinguishing test | Cost of missing it |
|---|---|---|---|
| Auction pressure | Competitor demand rose; your ad is unchanged | Did untouched campaigns move too? | You refresh creative that was never broken |
| Seasonality | User intent and purchase timing shifted | Does the same window repeat year over year? | You optimise against a trend you cannot beat |
| Audience saturation | The addressable pool ran out | Is new reach still growing while impressions climb? | New creative delivers a two-day bump, then flatlines |
| Post-click breakage | The page, form, checkout, or stock broke | Where does the click-to-outcome ladder first break? | You blame the ad while revenue leaks downstream |
| Creative fatigue | Repeat viewers stopped responding to this asset | Is the decline concentrated in repeat-exposure cohorts? | Genuinely the one case where new creative is the answer |
Note the ordering. It is deliberate, and it is the reverse of how most teams work.
Confirm the symptom is real
Before diagnosing anything, establish that the numbers you are reacting to describe reality.
Separate your metrics into two groups:
- Delivery metrics — CPM, impressions, reach, frequency, CTR. These are measured inside the ad platform’s own auction and serving system. They are rarely wrong.
- Outcome metrics — conversions, CPA, ROAS, lead volume. These depend on tags firing, server-side events matching, consent states, attribution windows, and analytics configuration. They drift constantly.
The test: pull platform-reported conversions and backend or CRM records for the same window, matched on the same timezone. Then pull the same comparison for a window before the problem started. If the gap between the two widened over the same period your CPM rose, you are looking at a measurement problem sitting on top of — or instead of — a delivery problem.
Check what changed in that window: attribution window settings, Conversions API deduplication, event match quality, a consent banner update, a GA4 property change, a tag manager deployment, a site migration.
This takes twenty minutes and costs nothing. Skip it and every subsequent conclusion is built on numbers that may not describe anything that happened.
Once the delivery signal is confirmed real, work the differential from cheapest to most expensive.
The differential, in diagnostic order
Condition 1: Auction pressure
What it is: the price of an impression rose because more advertisers are bidding for the same attention. Nothing about your ad changed. The market did.
Meta’s ad auction does not simply award the impression to the highest bidder. Per Meta’s own documentation on how the auction works, the winning ad is the one with the highest total value, built from the advertiser bid, the estimated action rate, and ad quality. When more advertisers enter with larger budgets, you need a higher effective total value to win the same impression — so the same estimated action rate now costs more. Google’s auction behaves comparably through Ad Rank, computed fresh at every auction.
The distinguishing test — the untouched control. Every account should keep at least one campaign or ad set that has gone thirty days or more without a significant edit. An evergreen brand campaign or a stable retargeting ad set works well. Pull its CPM over the same window.
If the untouched campaign’s CPM rose by a comparable proportion, the increase is environmental. An ad you did not touch cannot have fatigued.
Second signal: auction pressure raises the cost of an impression. It does not make your creative less appealing. So a clean auction-pressure pattern shows CPM up with CTR roughly flat. If CTR is also falling, you likely have a second condition stacked on top — which is exactly what festival season produces.
The fix: none, at the creative level. Decide whether the higher price is still profitable at your contribution margin. That is a spend decision, not a production decision.
Condition 2: Seasonality
What it is: your audience’s behaviour changed. Same people, different intent, different purchase timing, different attention.
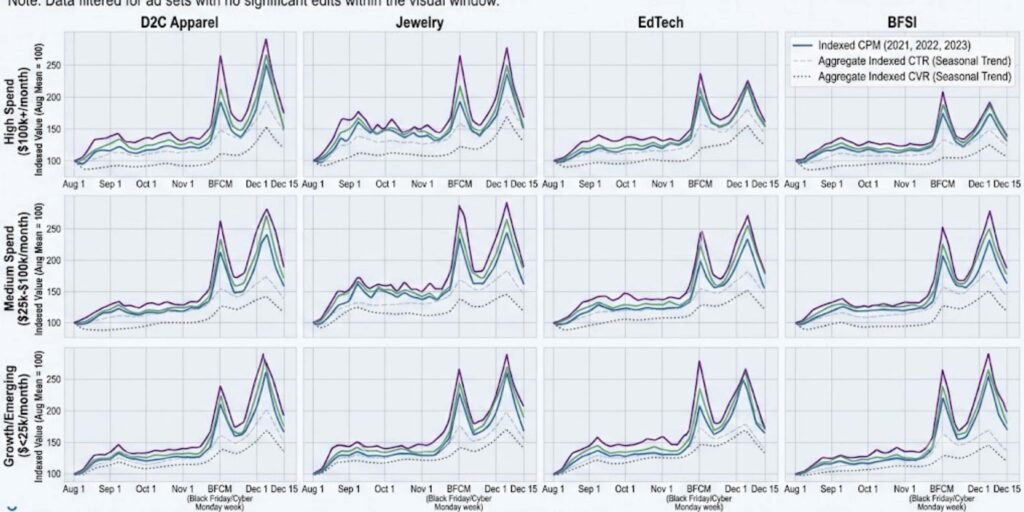
The distinguishing test — year over year, not month over month. Compare the same calendar window against the previous year, and the year before that. If the shape repeats annually, no creative decision will flatten it.
Second test — check your unpaid channels. If organic sessions, direct traffic, and email click-through softened in the same week, the change is in the market, not in your ad account. A creative problem does not depress your email list.
Distinguishing seasonality from auction pressure: auction pressure is a supply-and-price effect — cost per impression moves, conversion rate holds. Seasonality is a demand effect — conversion rate, add-to-cart rate, and session-to-lead rate move. They can and do occur simultaneously.
Condition 3: Audience saturation
What it is: the delivery system has run out of new people it can profitably serve under your current constraints. Frequency rises not because the algorithm chose repetition, but because there is nobody new left.
The distinguishing test — the reach-to-impression divergence. Plot daily new reach against daily impressions across 28 days.
- Reach still expanding while response declines → points toward fatigue.
- Reach flattening while impressions keep climbing → saturation.
The confirmatory test, and the sharpest one in this article — expand the pool, hold the creative constant. Widen the geography, remove an age restriction, drop a stale exclusion list, or move from a narrow interest stack to broad. Change nothing about the asset.
If CPM falls and CTR recovers with the same creative, the asset was never the problem. You just saved a production cycle.
The fix: pool expansion, exclusion audit, or a structural consolidation if overlapping ad sets are competing against each other for the same users.
Condition 4: Post-click breakage
What it is: the ad works. What happens after the click stopped working. A plugin update slowed the page. A payment method started failing. A hero SKU went out of stock. A form field broke on one mobile browser. Someone changed the price.
The distinguishing test — the click-to-outcome ladder. Walk the funnel one step at a time for the affected window and find the first rate that broke:
- Impression → click (CTR)
- Link click → landing page view — the single most under-used diagnostic on Meta. A widening gap between the two means people are clicking and the page is not loading fast enough to register.
- Landing page view → engagement or scroll depth
- Engagement → add to cart or form start
- Add to cart or form start → purchase or submit
Everything upstream of the first broken step is healthy. Stop diagnosing it.
Second test — segment by device, browser, and payment method. Breakage is usually narrow. Genuine creative decay is usually broad.
And here is the loop almost nobody explains. Post-click breakage does not merely suppress conversions. It raises your CPM. If the auction ranks ads partly on estimated action rate, and your conversion signal has degraded because checkout is failing, then the system’s estimate of your action rate falls — and you must bid harder to win the impressions you were winning last week.
A broken checkout looks exactly like creative fatigue in your CPM chart. It is not.
Condition 5: Creative fatigue
Only now. Last, not first — because the fix is the most expensive intervention available: production spend, brief cycles, review rounds, and a delivery reset on ad sets that may have been performing well.
The distinguishing test — the cohort split. Fatigue is a repeat-exposure phenomenon. Separate the performance of people encountering the ad for the first time from those seeing it again. If first-exposure response is holding and only repeat-exposure response is declining, the asset has genuinely worn out.
If response is falling even among people seeing the ad for the first time, the asset is not fatigued. It was either never strong, or one of the four conditions above is doing the work.
Second test — the rest-and-reintroduce. Pause the asset. Reintroduce it later to a fresh cohort. A fatigued creative often recovers. A structurally weak one does not.
The fix: new creative — but built against the gap your diagnosis exposed, not simply a new edit of the same idea. This is where a coverage framework earns its keep: if the fatigued asset was your only ad addressing a particular awareness level or objection, replacing it with a cosmetic variant reproduces the same wear pattern in six weeks.
The decision tree
Run in this order. Stop at the first condition that explains the data.
START — CPM rising, CTR falling

STEP 0  Do platform outcomes still match backend records?
        NO  → Measurement problem. Fix tracking before diagnosing anything.
        YES ↓

STEP 1  Did campaigns you have NOT edited in 30+ days also see CPM rise?
        YES → AUCTION PRESSURE. Re-evaluate economics, not creative.
        NO  ↓

STEP 2  Does this same calendar window show the same shape in prior years?
        And did organic / direct / email soften at the same time?
        YES → SEASONALITY. Reset expectations against a seasonal index.
        NO  ↓

STEP 3  Is daily new reach flattening while impressions keep rising?
        Test: widen the pool, hold the creative constant.
        RECOVERS → AUDIENCE SATURATION. Expand pool, audit exclusions.
        NO CHANGE ↓

STEP 4  Walk the click-to-outcome ladder. Does any step break before
        the purchase or submit?
        YES → POST-CLICK BREAKAGE. Fix the page, not the ad.
        NO  ↓

STEP 5  Is the decline concentrated in repeat-exposure cohorts, with
        first-exposure response holding?
        YES → CREATIVE FATIGUE. Now — and only now — brief new creative.
        NO  → The asset was never strong. Different problem entirely.
The Festival CPM Index Tracker
The differential only works if you have something to compare against. This workbook builds it. Paste your daily numbers, and it indexes every month against that account’s own August — so you can tell auction pressure from creative fatigue instead of guessing. Days you edited an ad set are excluded automatically, because a creative change contaminates an environmental reading.
Five sheets. Formulas built in. Worked examples showing the format.
Three seasons of this data is the thing no competitor can copy from you. This year is season one.
The Indian festival season problem nobody writes about
Every diagnostic guide written for a US audience assumes two demand peaks: Black Friday and December. Indian accounts do not work that way.
From roughly early September through late November, Indian ad auctions absorb a near-continuous run of high-intent commercial occasions — Onam, Ganesh Chaturthi, Navratri, Durga Puja, Dussehra, Dhanteras, Diwali — followed immediately by the imported Black Friday and Cyber Monday cycle and then year-end. That is eight to ten continuous weeks in which almost every advertiser in the country raises budget simultaneously.
Available impression inventory does not expand proportionally. Demand does. The result is textbook Condition 1: auction pressure across an entire market, for an entire quarter.
The trap
The sequence plays out in nearly identical form every year:
- CPM climbs in week two of September.
- The team diagnoses creative fatigue, because that is what every checklist says.
- They pull a working asset and push new creative into live ad sets mid-season.
- Significant edits return ad sets to the delivery system’s learning phase. Per Meta’s documentation on the learning phase, an ad set exits only after accumulating roughly 50 optimisation events in a seven-day period.
- The account now spends its most expensive weeks of the year in a reset state, on unproven assets, against maximum competition.
They did not fix fatigue. They manufactured instability during the exact window where stability compounds hardest.
The Google-side trap
Advertisers running Search, Shopping, or Performance Max often reach for seasonality adjustments here. That instrument does not fit this problem.
Google’s own documentation is explicit: seasonality adjustments are intended for short events of one to seven days, and may not work as well when applied for extended periods of more than fourteen days at a time. It also notes that Smart Bidding already manages seasonal events without intervention.
The Indian festival window is eight to ten weeks. A seasonality adjustment is the correct tool for a 72-hour Dhanteras flash sale. It is the wrong tool for the season itself. For the season, the levers are target adjustment on tCPA or tROAS, budget scaling, and campaign-level preparation done in advance.
What to do between September and November instead
Move production before the season. Build and validate your festival creative in July and August, in normal auction conditions, where a test result means something. Enter September with proven assets and a frozen refresh calendar.
Set two baselines, not one. A pre-season baseline (the thirty days before the first festival) tells you what normal costs. A seasonal index (this window, prior years) tells you what normal costs in this window. Judge in-season performance against the second one. Measuring festival CPM against August CPM will make a healthy account look broken every single year.
Keep one untouched control ad set running the entire window. No edits, no budget changes, modest spend. It is your environmental thermometer this year and your benchmark next year.
Re-target the economics, not the creative. If CPM rises 30% while conversion rate rises 20%, your acceptable CPA has moved. Decide on contribution margin whether the higher volume is worth the higher cost. That is a P&L decision made in a spreadsheet, not a decision made in Ads Manager.
Bank the data. Export the curves in December while the year is fresh. Three seasons of indexed data turns an annual panic into a forecast.
Before you brief another creative round
Rising CPM with falling CTR will keep appearing in your reports. It is one of the most common patterns in paid media and one of the least diagnostic.
The teams that stay profitable through it are not the ones with the fastest creative pipelines. They are the ones who spend twenty minutes on a differential before spending three weeks on production.
FAQs
How do I tell ad fatigue from audience saturation?
Put the same creative in front of a larger pool. Widen the geography, remove an age band restriction, or drop a stale exclusion list — and change nothing about the asset. If CPM falls and CTR recovers with the identical creative, it was saturation. If nothing improves, fatigue becomes the stronger candidate. Frequency and CTR alone cannot separate the two, which is why most checklists fail here.
Why is my CPM rising when my ads haven’t changed?
Most commonly because auction competition increased. CPM is a market price, not a quality score. Confirm it by checking a campaign you have not edited in thirty days or more — if its CPM rose by a similar proportion, the change is environmental and no creative decision will reverse it.
What frequency means my ad is fatigued?
There is no universal threshold. Frequency is a symptom shared by fatigue, saturation, and narrow targeting, so a number alone diagnoses nothing. What matters is whether response is falling among people seeing the ad for the first time. If first-exposure response is stable, high frequency is a reach problem, not a creative one.
Does refreshing creative reset the learning phase?
Significant edits to an ad set return it to the learning phase, and Meta’s documentation describes exiting that phase after roughly 50 optimisation events in a seven-day window. This is why creative refreshes should be diagnosed carefully rather than applied reflexively — particularly during high-cost periods.
Can a broken landing page increase my CPM?
Yes. Meta’s auction weighs estimated action rate alongside your bid. When downstream conversion signal degrades — a slow page, a failing payment method, an out-of-stock item — the estimated action rate falls, and you must bid more aggressively to win impressions you were previously winning. Post-click breakage shows up as an ad-delivery symptom.
Why does my CPM rise every Diwali even when my ads are performing well?
Because from September to November, Indian advertisers across nearly every category raise budgets simultaneously while available impression inventory stays broadly flat. It is market-wide auction pressure. Refreshing creative during this window usually makes performance worse, because it resets delivery on assets that were working.
Should I use Google Ads seasonality adjustments for festival season?
Not for the season as a whole. Google’s documentation states that seasonality adjustments are intended for short events of one to seven days and may not work as well beyond fourteen days at a time. Use them for a specific 48- or 72-hour sale event. For the eight-to-ten-week festival window, adjust tCPA or tROAS targets and scale budgets instead.
How long should I wait before deciding an ad is fatigued?
Long enough to have a trend rather than a data point. Read four-week trends, not day-to-day movement, and run the differential first. Most decisions labelled “fatigue” after seven days are decisions made on noise.
Keep learning with people doing the work.
Join the Stay Ahead community for useful marketing updates, practical resources, workshops, and real conversations.